US Life Expectancy 2024: Data, Trends, Comparisons
Few numbers carry as much weight as life expectancy—it sums up health, healthcare, and daily life in a single year. According to the latest data from the CDC, the average American born in 2024 can expect to live 79 years, a half-year improvement from the year before.
Overall life expectancy (2024): 79.0 years ·
Male life expectancy: 76.5 years ·
Female life expectancy: 81.4 years ·
Comparison to other high-income countries: 3.7 years lower than average ·
Leading cause of death: Heart disease
Quick snapshot
- U.S. life expectancy at birth reached 79.0 years in 2024 (CDC Data Brief, NCHS)
- Female life expectancy: 81.4 years; male: 76.5 years (CDC FastStats)
- Heart disease is the leading cause of death (CDC FastStats) (CDC Data Brief, NCHS)
- Exact future life expectancy trends depend on public health developments, including obesity rates and pandemic risks.
- Individual life expectancy for any specific person—like a 78-year-old male—carries wide statistical uncertainty.
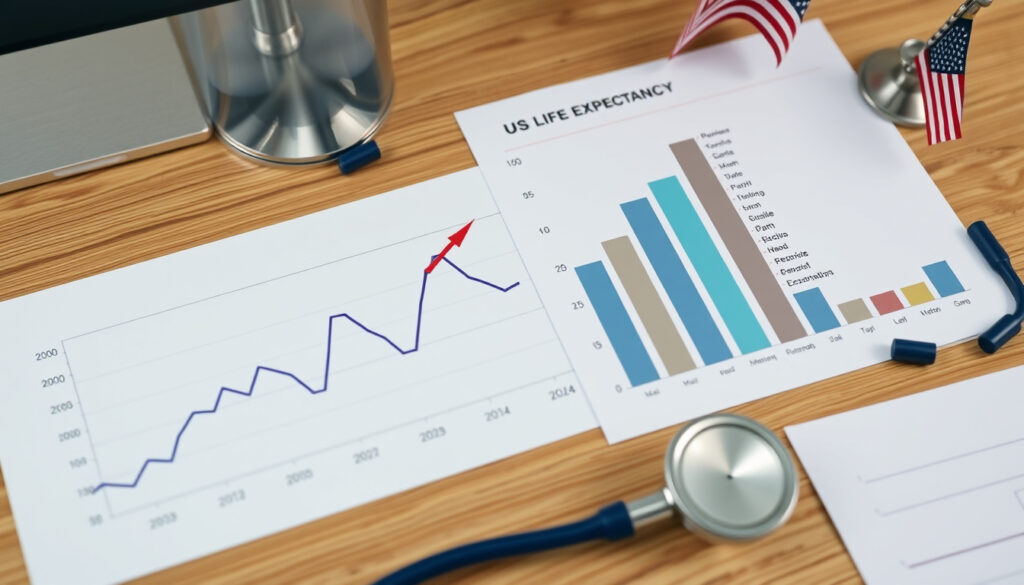
- Life expectancy rose from ~68.2 years in 1950 to 79.0 years in 2024, with a pandemic dip to ~77.0 in 2020 (CDC Data Brief, NCHS)
- The 2024 figure is the highest ever recorded.
- Continued recovery from COVID-19 mortality, but persistent disparities by race and income may slow progress.
- Medicare and Social Security solvency projections hinge on whether life expectancy growth continues.
Key life expectancy facts at a glance reveal the core metrics driving the national conversation.
| Measure | Value | Source |
|---|---|---|
| Overall life expectancy (2024) | 79.0 years | CDC Data Brief |
| Male life expectancy | 76.5 years | CDC Data Brief |
| Female life expectancy | 81.4 years | CDC Data Brief |
| Female-male gap | 4.9 years | CDC Data Brief |
| Leading cause of death | Heart disease | SSA Actuarial Tables |
| Odds of living to 90 (at age 65) | ~30% | SSA Actuarial Tables |
How long does the average US male live?
The CDC reports that male life expectancy at birth in 2024 was 76.5 years, up 0.7 year from 2023 (CDC Data Brief). This is 4.9 years shorter than the average female’s 81.4 years. At age 65, men can expect another 18.4 years on average, while women at 65 can expect 20.8 more years (CDC Data Brief).
What is the average life expectancy for US women?
Female life expectancy in 2024 hit 81.4 years, an all-time high. The gap between men and women has narrowed slightly—by 0.4 year from 2023—as male gains outpaced female gains (CDC Data Brief).
How does life expectancy differ by gender in the US?
The 4.9-year female advantage is consistent with international patterns, though the gap varies by country. In Japan, the gap is about 6 years; in Sweden, about 3 years (The Hill (health policy reporting)).
Men aged 65 in the U.S. can expect 2.4 fewer years of life than women of the same age. For retirement planning and healthcare costs, that difference is roughly the equivalent of a full benefit phase.
The implication: The gender gap persists, but men’s faster recovery from pandemic-era losses suggests that targeted public health efforts—like better cardiovascular prevention—could further narrow the gap.
Which country has the highest life expectancy?
Japan, Switzerland, and Singapore consistently top global rankings with life expectancies above 84 years (World Population Review (global rankings database)). The U.S. ranks 29th among OECD countries, about 3.7 years below the high-income average.
Which country has the shortest life expectancy?
Countries in sub-Saharan Africa, such as Chad and Lesotho, have life expectancies below 60 years, driven by infectious disease, maternal mortality, and conflict (The Hill).
How does the US rank globally in life expectancy?
Among peer nations, the U.S. has the lowest life expectancy despite spending more per capita on healthcare (World Population Review).
The U.S. spends roughly $12,000 per person on healthcare—double the OECD average—yet its citizens die nearly 4 years earlier than people in comparable nations. Access, obesity, and gun violence are among the factors that explain the gap.
The trade-off: High spending does not automatically translate to longer lives. The U.S. must address systemic inequities to close the gap with top performers.
What is the leading cause of death in the United States?
Heart disease has been the leading cause of death in the U.S. for decades, followed by cancer and unintentional injuries (CDC FastStats). In 2024, the age-adjusted death rate fell 3.8%, driven in part by fewer COVID-19 deaths.
What are the top 10 causes of death in the US?
CDC data lists heart disease, cancer, unintentional injuries, chronic lower respiratory diseases, stroke, Alzheimer’s disease, diabetes, influenza/pneumonia, kidney disease, and suicide in the top ten (CDC Data Brief).
What is the most common cause of death after age 90?
After age 90, heart disease and Alzheimer’s disease become the dominant causes. Among centenarians, heart disease and stroke account for over half of deaths (SSA Actuarial Tables).
The pattern: Chronic diseases, not infections, are the main drivers of U.S. mortality. Prevention—especially for heart disease—has the largest potential to extend life.
What are the odds of living to 90 years old?
According to the Social Security Administration’s actuarial tables, about 30% of 65-year-olds today will live to age 90 (SSA Actuarial Tables). The odds of reaching 100 are far lower—roughly 1 in 1,000 for a 65-year-old.
Has any human lived for 200 years?
No. The oldest verified human lifespan is 122 years, achieved by Jeanne Calment of France (The Hill). There is no evidence of anyone living beyond 130.
What is the biggest indicator of long life?
Genetics account for roughly 20–30% of longevity, but lifestyle factors—diet, exercise, not smoking, and managing stress—play a larger role. Socioeconomic status and access to healthcare are also strong predictors (CDC FastStats).
If you’re a 65-year-old non-smoker with healthy blood pressure and weight, your odds of living to 90 may be 50% or higher, compared to 30% for the general population. Small changes in lifestyle compound into years of life.
What this means: Longevity is not a lottery. Modifiable factors have a bigger impact than many people realize.
How long is Trump expected to live?
Individual life expectancy cannot be predicted with certainty. For a 78-year-old male like Donald Trump, the SSA actuarial life table shows an average remaining life expectancy of about 9.5 years (SSA Actuarial Tables). This is a population average; actual outcomes vary based on health, behavior, and family history.
How is life expectancy calculated for an individual?
Actuaries use age-specific mortality rates from large populations to produce remaining life expectancy. For a 78-year-old male, the probability of dying within the next year is about 5% (SSA Actuarial Tables).
What do actuarial tables say about a 78-year-old male?
A 78-year-old male has a 50% chance of living to about 87 and a 25% chance of reaching 92 (SSA Actuarial Tables). These are probabilistic, not deterministic.
The implication: Media speculation about a specific person’s remaining years is misleading. Only population-level averages are reliable.
What factors influence life expectancy in the US?
Life expectancy varies dramatically by state and race. Hawaii leads the nation at 81.11 years, while Mississippi has the lowest at around 73 years (World Population Review (state rankings table)). Black Americans live, on average, 4 to 6 years fewer than White Americans, depending on the data set.
How does life expectancy vary by state?
State-level data from World Population Review show Hawaii at the top (81.11 overall, 77.92 male, 84.43 female) and Mississippi at the bottom. New Jersey ranks high as well (81.08 overall). Lifestyle, healthcare access, and income explain much of the spread.
How does life expectancy vary by race?
CDC data consistently show that Black Americans have lower life expectancy than White Americans—a gap of roughly 4 years for men and 3 years for women (CDC FastStats). Hispanic Americans have comparable or slightly higher life expectancy than White Americans, a phenomenon known as the “Hispanic paradox.”
State-level data highlights the stark geographic divide in American longevity.
| State | Overall LE | Male LE | Female LE |
|---|---|---|---|
| Hawaii | 81.11 | 77.92 | 84.43 |
| New Jersey | 81.08 | 78.19 | 83.86 |
| U.S. national average | 79.0 | 76.5 | 81.4 |
| Mississippi | ~73.0 | ~70.0 | ~76.0 |
Four states, one pattern: geography is destiny. The eight-year gap between Hawaii and Mississippi underscores how environment and policy shape lifespan.
What role do healthcare access, income, and education play?
Higher income and education are consistently associated with longer life. A study cited by The Hill notes that Americans in the top 1% of income live about 10 to 15 years longer than those in the bottom 1% (The Hill).
While overall life expectancy is rising, inequality in longevity is also growing. A person born in a low-income neighborhood can expect to die a decade earlier than someone born in a high-income one just 50 miles away.
Why this matters: Narrowing these disparities would do more to raise U.S. life expectancy than any single medical breakthrough.
“The 2024 data show a promising recovery in U.S. life expectancy, driven largely by declines in mortality from COVID-19 and heart disease.”
— CDC National Center for Health Statistics (CDC Data Brief)
“Our actuarial life tables provide a reliable basis for estimating remaining life expectancy at any age, but individual outcomes vary widely due to health and lifestyle factors.”
— SSA Office of the Chief Actuary (SSA Actuarial Tables)
Confirmed facts
- U.S. life expectancy at birth in 2024: 79.0 years (CDC).
- Heart disease is the #1 killer (CDC).
- U.S. life expectancy is lower than most other high-income countries (OECD data).
What’s unclear
- Whether the upward trend will continue given rising obesity and drug overdose deaths.
- How quickly state-level disparities will narrow.
- Individual life expectancy for any specific person, including public figures.
- Hawaii has the highest state life expectancy; Mississippi the lowest (World Population Review).
For policymakers and healthcare providers, the choice is clear: invest in prevention and equity, or accept a widening gap between the U.S. and its peers. For individuals, the message is equally direct—lifestyle choices today are the largest lever on your own timeline.
onlinedegrees.kent.edu, thehill.com, en.wikipedia.org, usafacts.org, aha.org, pubmed.ncbi.nlm.nih.gov, cdc.gov, macrotrends.net
Frequently asked questions
What is the life expectancy in the US for 2025?
As of early 2025, the most recent official figure is 79.0 years for 2024. Projections for 2025 are not yet available, but the trend suggests a continued gradual increase if no major public health crisis occurs.
How does life expectancy differ by race in the US?
Black Americans have lower life expectancy than White Americans by about 4–6 years. The gap is partly explained by disparities in healthcare access, income, and chronic disease prevalence.
What was the impact of COVID-19 on US life expectancy?
In 2020, US life expectancy dropped to about 77.0 years, losing nearly 1.5 years in a single year. By 2024, it recovered to 79.0 years, surpassing the pre-pandemic peak.
How is life expectancy calculated?
Life expectancy is derived from age-specific death rates in a population. Actuaries and demographers build life tables that track mortality at each age to compute the average number of years remaining.
What is the life expectancy in the US by state?
Hawaii leads at about 81.1 years, while Mississippi is lowest at around 73 years. Most states fall between 75 and 80 years.
What is the life expectancy for smokers in the US?
Smokers lose an average of 10 years of life compared to non-smokers. A 30-year-old smoker has a life expectancy about 10 years shorter than a non-smoker of the same age.
Bottom line: US life expectancy in 2024 reached a record 79.0 years, but the national average conceals deep disparities by gender, race, and state. For individuals, the biggest gain comes from lifestyle changes; for the country, tackling inequality is the most effective path to longer lives.
More related posts
 What Does Heartburn Feel Like – Symptoms vs Heart Attack
 Disney Store Near Me: UK, Ireland & EU Locations 2025
 How Bad Is Your Spotify? AI Roast Tool & Listener Stats
 Robert F. Kennedy: Assassination, Legacy & RFK Jr.’s Brain Worm
 St. Louis Cardinals vs Pittsburgh Pirates Match Player Stats – 2024 Box Scores and Key Highlights
 The Legend of Korra: LGBTQ+ Rep, Disability, and Where to Watch
 Emilie Kiser Trigg Drowning: Tragedy, Forgiveness, Legal Outcome
 Leanne Morgan Movies and TV Shows: Complete List (2025)